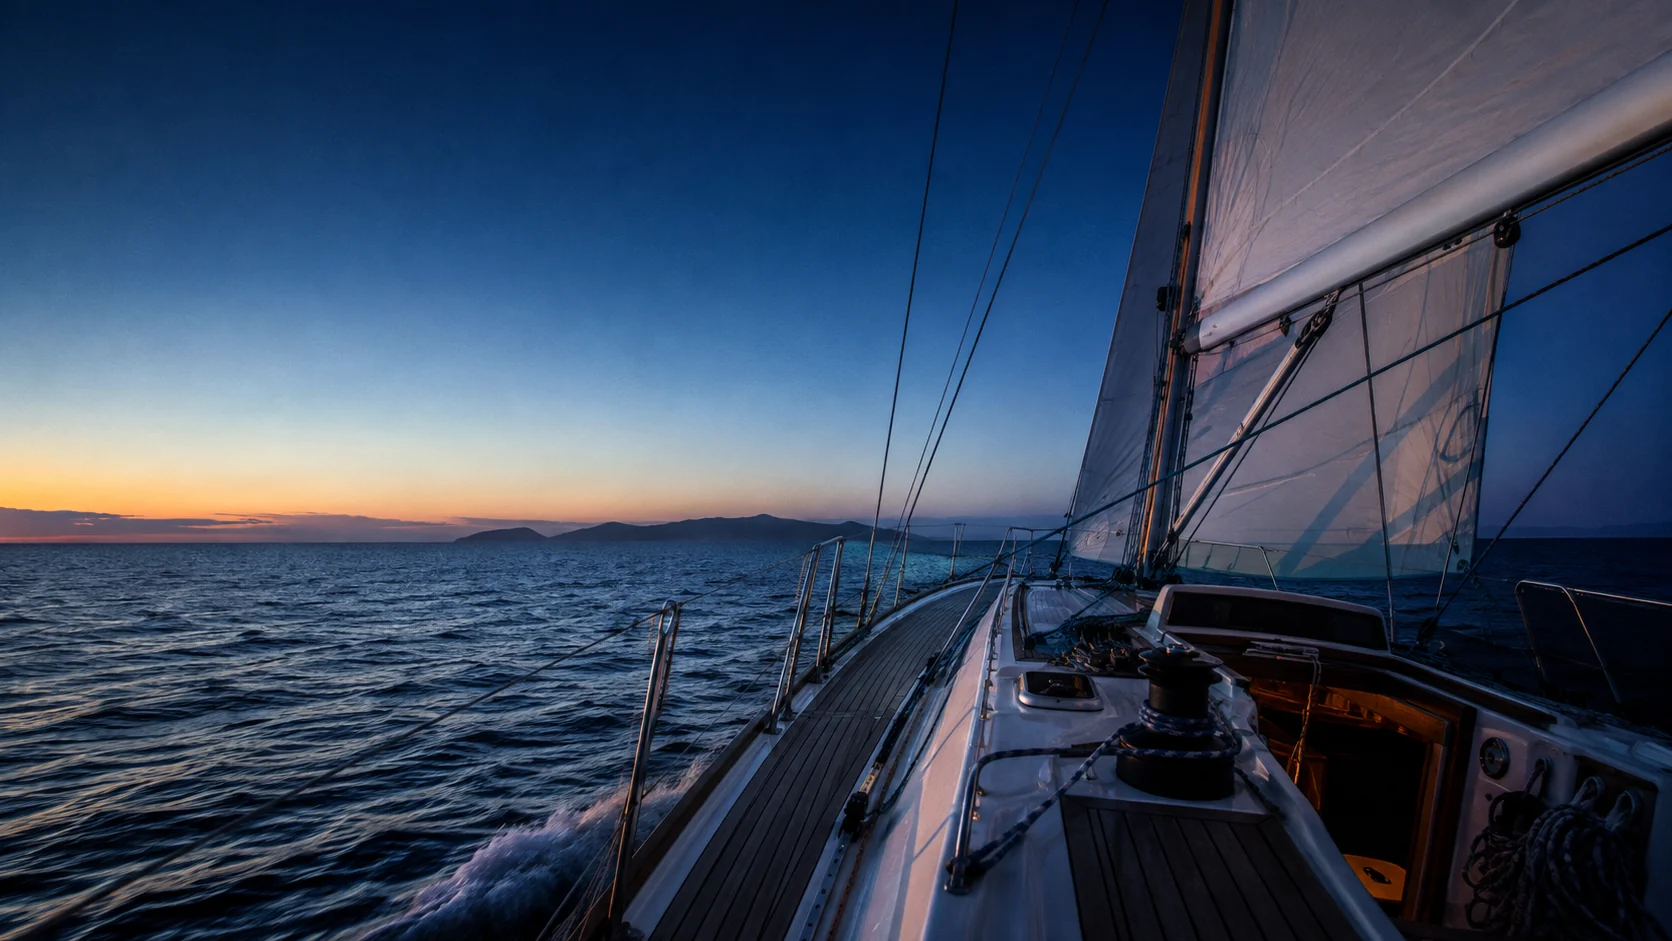
Routes for your boat
Boat-specific polars, forecast choice, depth constraints and weather along the route. Inspect the assumptions behind a departure.
 TelltaleINTELLIGENCE FOR THE WATER
Support ↗
A closer reading of the water
A regional forecast is a starting point. Telltale brings the headland, the channel and the bay into the picture.
Built aboard. Developed by Wayfarer Labs ↗
Wind around islands & through straitsLee shelter, ridge acceleration and gap flow.
Coastal wave propagationFollow the energy into the bay.
Source-aware currentsKeep the model’s native scale visible.
01 / A forecast meets a coastline
An island can shelter one shore, accelerate a channel and turn the flow around its edge. A finer picture matters when those are the places you sail.
TCW adds a diagnostic terrain response to the driving forecast. TIW brings the same attention inland, where lake shores, valleys and the overnight cooling cycle matter. The parent model remains identifiable throughout.
Inside Coastal Wind & Inland Wind ↗04 / One connected sailing system
Follow the decision from the weather field to a passage, an anchorage and a record of what actually happened.
Boat-specific polars, forecast choice, depth constraints and weather along the route. Inspect the assumptions behind a departure.
Use the app on a phone or tablet. Add the onboard Bosun for live instruments, local connectivity and continuous logging.
Polar performance, forecast comparisons and recorded conditions keep predictions connected to the boat’s own experience.
Energy budgets, solar forecasts, equipment, maintenance and voyage history share the same vessel context.
Illustrative five-leg passage. It is separate from the actual app screenshot above.
THE PASSAGE, STEP BY STEP
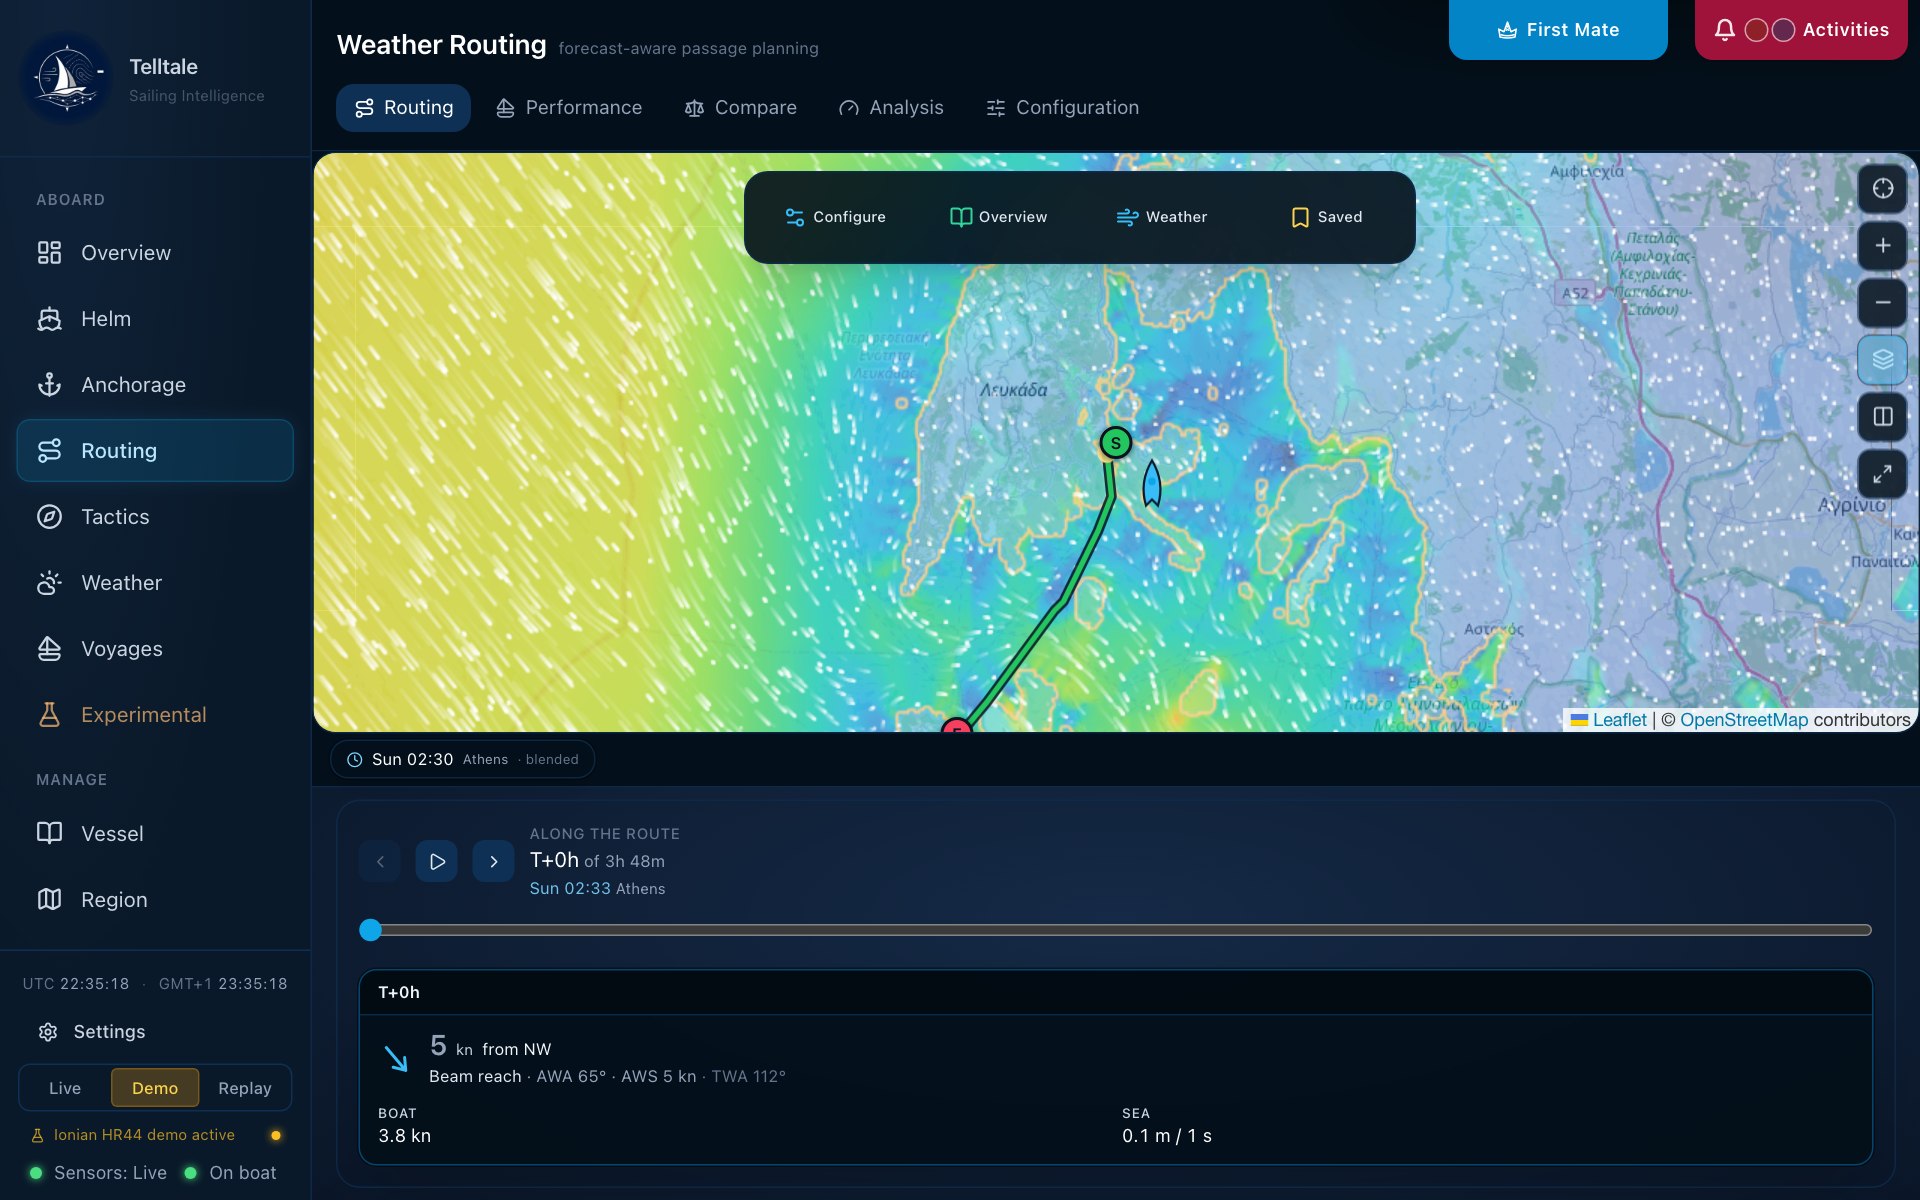
The product screenshot shows the routing map, forecast timeline and conditions along the passage. Inspect the same interface used aboard, with the source and forecast time alongside the passage.
See the current app interface ↗Product editions & getting Telltale ↗Open the user manual ↗AT ANCHOR / SHELTER IS NOT THE WHOLE STORY
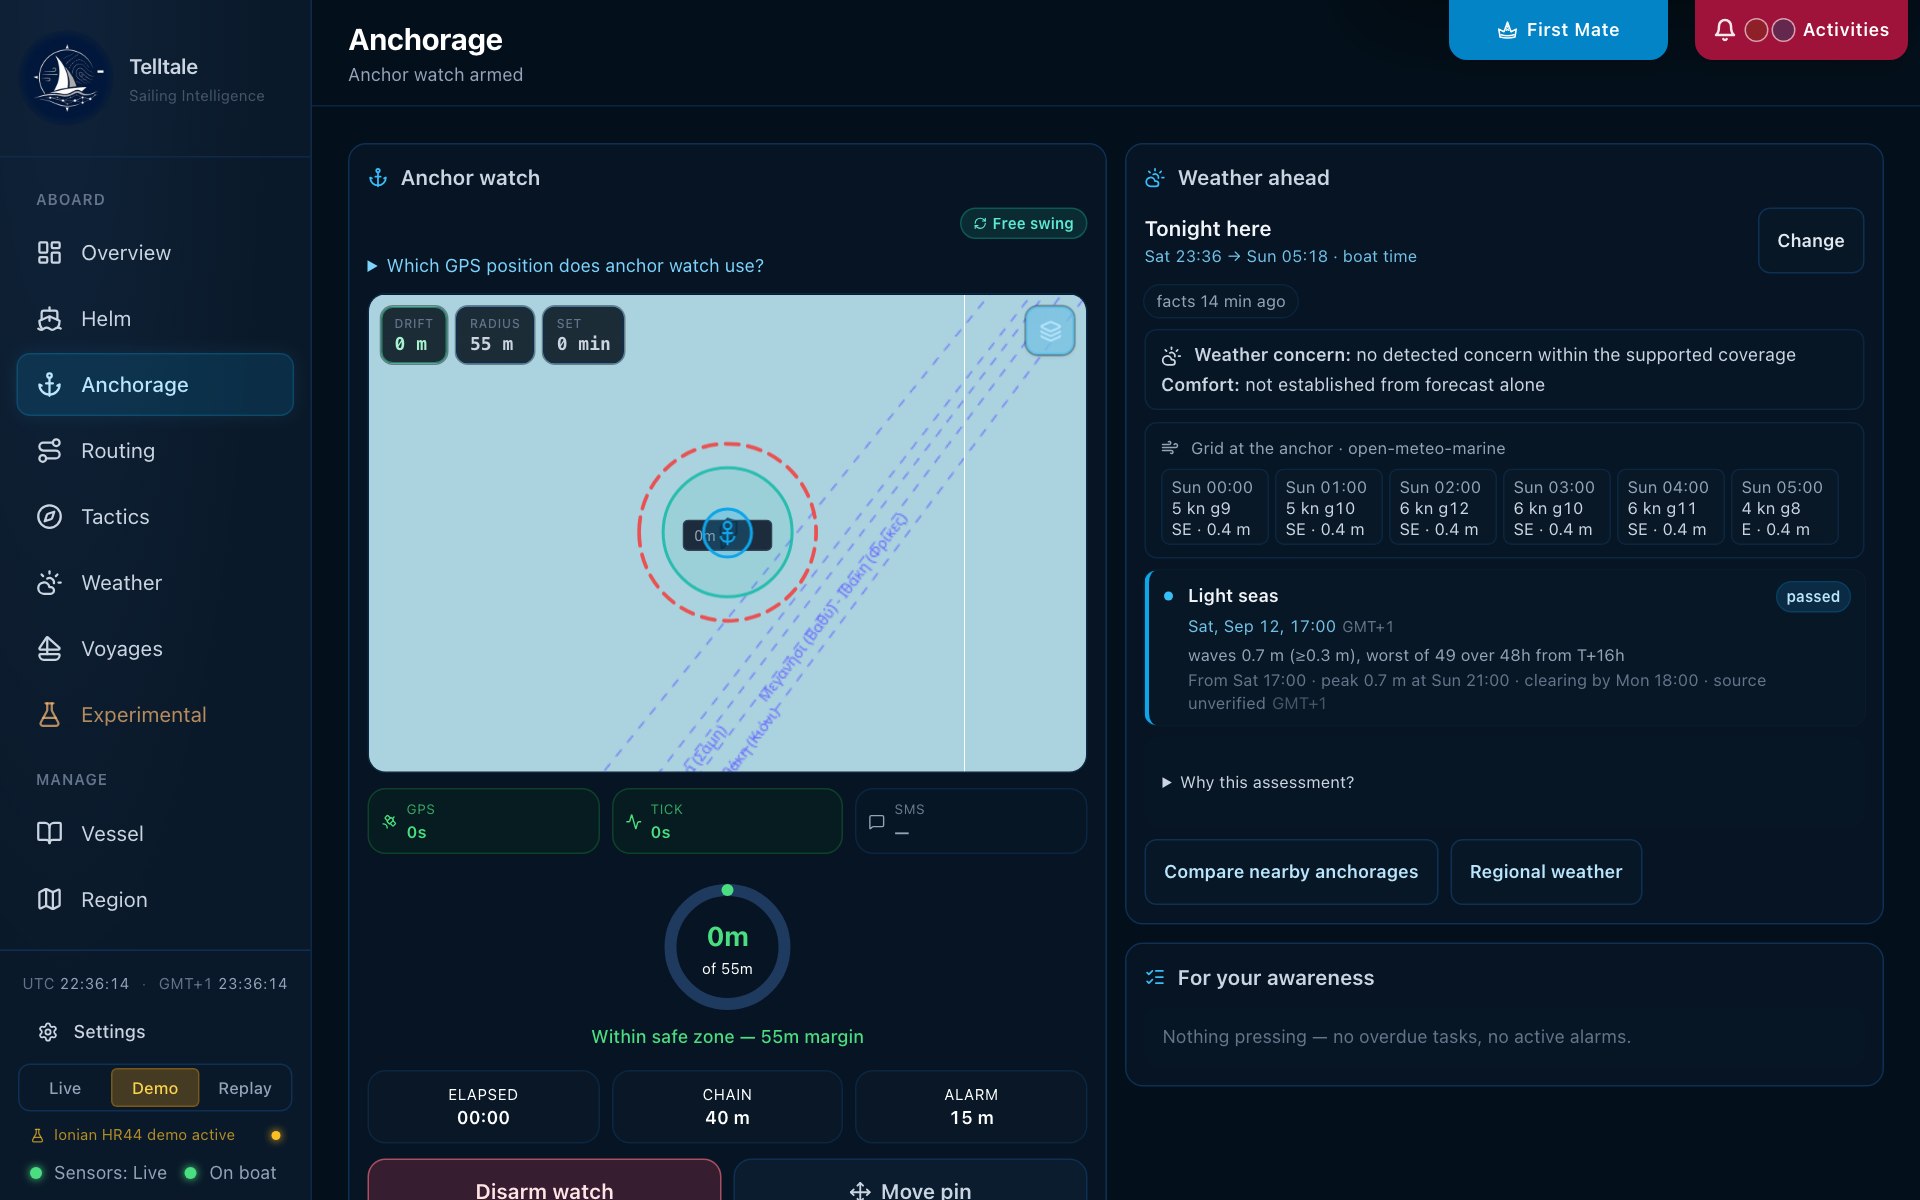
Follow wind, swell and heading through a night at anchor. Shelter and comfort are related, but they are different questions.
READ THE INTERACTION
The headland takes the strength out of the wind. Swell still bends around it and reaches the anchorage.
The anchorage heading and roll model is under development; coefficients are provisional. Coarse current input remains visibly coarse.
Read the assumptions ↗THE PHYSICS OF AN UNEVENTFUL NIGHT
Wave height on its own cannot tell you how comfortable the boat will be.
The coastal wave solver propagates directional energy through depth changes, shelter, diffraction and reflection. The heading estimate then weighs windage against underwater drag. Swell is considered relative to that heading, rather than only as a height at a pin.
The wave solver is a steady-state directional approximation, not a full frequency spectrum or harbour-resonance model. It does not include wave–current coupling. The anchorage model is a development feature with provisional vessel coefficients; unknown stream input stays unknown.
METHODS / PROVENANCE / VALIDATION
Telltale combines the driving forecast with the terrain, shoreline and thermal structure of a sailing ground. Historical replay and station comparisons test different parts of that chain.
01 / TELLTALE COASTAL WIND
TCW combines terrain, the driving wind and atmospheric stability to calculate acceleration, channel flow, lee wakes and turning. A mass-consistent adjustment constrains the flow around land.
Thermal circulation adds a parametrised sea breeze, land breeze and nocturnal drainage. It is reduced where the parent forecast already resolves the circulation, to avoid counting the same effect twice.
Copernicus elevation and explicit water masks preserve islands, channels and inland water. The published grid depends on domain and computation budget.
TCW-E identifies ECMWF forcing; the I and G naming conventions identify ICON and GFS. The replay shown here is a saved model run, with its source recorded.
The configured field is about 500 m in latitude, with finer operational targets and coarser large-domain ramps. This is cell spacing, not an accuracy radius.
WIND / AROUND ISLANDS AND THROUGH GAPS
Watch the mechanism, then consider the sailing decision. These maps follow saved Telltale wind vectors around the real Ionian coastline. Select a numbered explanation to connect a local feature with the sailing decision.
02 / TELLTALE INLAND WIND
Water above sea level must still be treated as water.
Explicit lake masks preserve the real lake surface elevation. Shore contrasts, surrounding slopes and valley openings then have the right geometry for over-water flow and thermal effects.
North American lake observations now inform regional forecast selection. Alpine lake circulation and local corrections are evaluated separately.
INLAND WIND / THE LAKE AND THE SLOPES
COASTAL WAVES / FOLLOW THE ENERGY
Start with the actual Telltale wave animation. Then isolate depth, shelter and returning energy in controlled model experiments.
CURRENTS & TIDES / FLOW THROUGH GEOGRAPHY
Start with the saved regional current field. Then follow water around a complex coastline, through a narrowing passage and through flood, slack and ebb.
03 / THE VALIDATION RECORD
Historical reanalysis and archived operational forecasts answer different questions. TCW replays both through the production normaliser and downscaler, then compares at the reference’s own scale.
Evidence shown here: the documented October 2026 regional model-selection study. The current cross-region TCW validation record is being reconciled before publication.
The October 2026 study compared HRDPS and HRRR against lake buoys, shoreline stations and airport observations. HRDPS met the defined selection criteria for the Great Lakes aggregate and the Ontario / Ottawa study region. Telltale applies individual lake decisions where the evidence supports them. This tests the driving models; it is distinct from a TCW terrain-correction validation.
ERA5 provides the long historical baseline for replay. Dataset history and the period actually tested are reported separately.
CERRA adds a regional comparison at its own scale. Replay can test terrain and weather regimes across many historical episodes.
Observed station and buoy comparisons inform which regional forecast drives each sailing ground.
Validation in progress. Results will be published shortly.
ERA5 supplies historical forcing. CERRA and the 9 km IFS analysis provide regional comparisons. Aggregate fine cells up to the reference scale; retain episode-level uncertainty.
Replay the model run that was available before the weather happened. A reconstructed historical field is not a forecast issued a day in advance.
Airport reports constrain open-air forcing. Moorings and boat logs can test different settings. Sampling a point instrument is different from averaging into a model grid box.
Each replay episode records its source, valid time, code revision and explicit parameter set. The archive keeps cached inputs and per-terrain-bin errors, speed bias, circular direction error and whole-episode bootstrap bands.
04 / KNOW WHAT THE PICTURE CAN SAY
Diagnostic terrain and thermal response to a parent forecast. Small-scale features require small-scale observational validation.
Directional propagation with refraction, shelter, diffraction and reflection. Not a full frequency spectrum, harbour-resonance solve or wave–current coupling model.
Upstream ocean-current context at its native scale. A dense display is not a bay-scale tidal-stream forecast. The current replay uses saved Copernicus Marine surface vectors; tidal mechanism diagrams are conceptual.